Prognostic Impact of Cancer Stem Cell-Like Phenotypes in Pancreatic Ductal Adenocarcinoma
Received: 13-Oct-2016 / Accepted Date: 18-Oct-2016 / Published Date: 20-Oct-2016 DOI: 10.4172/2161-0681.1000295
Abstract
Aim: To investigate the expression of cancer stem cell-like phenotypes in invasive pancreatic ductal adenocarcinoma, we analysed the correlation between the expression status of stemness markers and minichromosome maintenance 2 (MCM2), and clinicopathological characteristics; we also evaluated the prognostic significance of cancer stem cell-like features. Methods and results: We performed immunohistochemical staining in 44 cases of invasive pancreatic ductal adenocarcinoma. Patients were classified into high-expression and low-expression groups on the basis of the expression level of CD133, CD44, ALDH1, EpCAM, and MCM2. Seventeen of the 44 cases (39%) demonstrated high expression levels of CD133, whereas 12 of the 44 cases (27%) demonstrated high expression levels of CD44; 36 of the 44 cases (81%) demonstrated high expression levels of ALDH1, and 21 of the 44 cases (47%) demonstrated high expression levels of EpCAM. MCM2 was expressed in the nuclei of cancer cells with a positive cell ratio that ranged from 10% to 70%. Frequent positive stemness markers and/or a low expression of MCM2 was significantly correlated with worse overall survival (P=0.030). We defined frequent positive stemness markers (number of highly expressed markers>3) and/or a low expression of MCM2 phenotypes as the representative pattern of a cancer stem cell-like phenotype. The cancer stem cell-like phenotype was identified as an independent factor of overall survival by univariate (P=0.03) and multivariate analysis (hazard ratio, 2.763%; 95% confidence interval, 1.121-6.813; P=0.0273). Conclusion: The cancer stem cell-like phenotype could be involved in therapeutic resistance, resulting in worse overall survival. The cancer stem cell-like phenotype can be an indicator of recurrence in cases of invasive pancreatic ductal adenocarcinoma.
Keywords: Pancreatic cancer; Invasive ductal adenocarcinoma; Immunohistochemistry; Prognosis; Cancer stem cell; MCM2
314782Introduction
Pancreatic cancer has the most aggressive character of any cancer, with a median survival of less than 6 months and a 5-year survival rate of less than 5% [1]. Furthermore, the lethality of this cancer has improved little during recent years [2]. The mechanisms underlying the high mortality of pancreatic cancer might not be simple; however, the contributing factors might include a locally advanced presentation and distant metastases, because sometimes the symptoms become obvious only in the advanced stages of this disease. Indeed, pancreatic cancer is a systemic disease with multiple metastases. Furthermore, pancreatic ductal adenocarcinoma (PDAC), the most common type of this cancer, responds poorly to conventional chemotherapeutic agents. Thus, pancreatic cancer remains a difficult disease to cure, and novel strategies for its treatment should be elucidated.
Recently, cancer stem cells have been identified for many neoplasms including hematopoietic, hepatic, ovarian, head and neck, prostatic, brain, bladder, breast, colorectal, and pancreatic cancers [3-5]. These cells are characterized by having several potentials including an extensive self-renewal ability, demonstrated either ex vivo or in vivo , a pluripotent differentiating capacity, and a cancer-initiating ability upon orthotopic implantation [6]. However, the classic definition of cancer stem cells should be re-evaluated by including recent knowledge resulting from the progress of studies in this field [7]. These putative cancer stem cells are often demonstrated in human cancer tissues as well as in cell line cells using cell surface markers such as CD44, CD24, CD34, epithelial specific antigen (ESA), CD133, EpCAM, and ALDH1 [5,8-12].
Cancer stem cells are believed to be resistant to chemotherapy as well as radiotherapy, although the mechanisms are not fully understood [13]. However, several factors are documented such as resistance to apoptosis, improved DNA repair, increased tolerance of DNA damage, low mitotic rate, increased ALDH1 oxidation of aldehydes or detoxification, and resistance via multi-drug resistant ABC transporters [2,14-18]. Cancer stem cells could be the therapeutic target of cancers [19,20]. Expression of stem cell markers has been linked to shorter survival in many types of cancers. For pancreatic cancers, CD133+ [21], CD44+, CD24+, ESA+ and ALDH1+ phenotypes [15,22,23] are associated with chemo resistance or radio resistance as well as worse patient prognosis.
In the present study, we used immunohistochemistry to investigate the expression of stemness markers-CD133, CD44, ALDH1, and EpCAM in samples of PDAC tissues. In addition, we estimated the frequency of the expression of minichromosome maintenance2 (MCM2) in tumor cells of the samples, which is known to reflect the cellular proliferative potential/status [24,25]. We expected that the combination of stemness marker expression and MCM2 expression would more precisely demonstrate the cancer stem cell-like phenotype in tumor tissues from patients with pancreatic cancer. Then, we analysed the correlation between the cancer stem cell-like phenotype and clinicopathological features as well as prognostic factors of patients with invasive PDAC.
Materials and Methods
Patients
According to the pathological database, during 2000-2014, 104 patients underwent pancreatic resection for invasive PDAC at the Tokyo Medical and Dental University Hospital. All pathological specimens were reviewed and re-evaluated for the histological type and pathological parameters according to the criteria by the WHO classification of 2010 [26]. Consequently, 44 cases were included in this study. Clinical and demographic information was collected from patient charts. The median age of the patients was 71 years (range, 29-86 years). According to the WHO staging system [26], 3 tumors were classified as stage I, 4 as II, 18 as III, 23 as IVA, and 6 as IVB. Lymph node dissection was performed in 28 patients. Forty-two patients underwent adjuvant chemotherapy and/or radiotherapy. The median follow-up period was 14 months (range, 1-122 months). During the follow-up period, 24 patients died because of pancreatic cancer. Overall survival (OS) was defined as the period between the day of operation and day of death, and recurrence-free survival (RFS) was defined as the period between the day of operation and day of recurrence detected by an imaging modality or by pelvic examination. The procedure of this study was approved by the Ethical Committee of Tokyo Medical and Dental University on June 23, 2015 (No. 1458).
Immunohistochemical staining
The antibodies used in this study are listed. One representative lesion of each case was selected for immunohistochemical staining of a formalin-fixed, paraffin-embedded tissue sample. Positive and negative controls were also used appropriately. The 4 μm thick paraffin sections were cut and placed on silane-coated glass slides. The sections were deparaffinized in xylene and rehydrated in downgraded alcohol. The antigen retrieval procedure was performed by autoclaving at 121°C for 20 min in citrate buffer (pH 6.0) for EpCAM and in antigen retrieval solution (pH 9.0; Nichirei Biosciences, Tokyo, Japan) for MCM2. For CD133 and ALDH1, the procedure was performed by microwaving at 97°C for 40 min in antigen retrieval solution (pH 9.0). The slides were then immersed in 3% H2O2-methanol for 10 min and pre-incubated with normal horse serum for 30 min. The sections were incubated overnight at 4°C with each antibody. Each antibody was detected by the avidin-biotinylated enzyme complex method (R.T.U. Vectastain Universal Elite ABC Kit, Vector Laboratories, Burlingame, CA, USA). The antibody against MCM2 was detected by the Novolink Polymer (RE7200-K, Leica Biosystems, Wetzlar, Germany). The DAB Peroxidase Substrate kit (Vector Laboratories) was used for the chromogenic reaction. DAB was used as a chromogen for CD133, CD44, ALDH1, and EpCAM, and Nickel DAB was used for MCM2. All sections were counterstained with Mayer’s hematoxylin.
Double immunostaining
The expression of MCM2 and the stemness markers was examined using a double immunostaining method. For double immunostaining, heat treatment and blocking were performed between each step. We used human tonsil samples as positive controls and confirmed that there was no cross reaction among the antigen detection steps.
| Clone | Animal species | Company | Dilution | |
|---|---|---|---|---|
| MCM2 | BM28 | Mouse, monoclonal | BD Transduction Laboratories, NJ, USA | 1:2000 |
| CD133 | PROM1 | Rabbit polyclonal | Abnova, Taiwan | 1:100 |
| CD44 | EPR1013Y | Mouse, monoclonal | Abcam, UK | 1:1000 |
| ALDH1 | EP1933Y | Rabbit monoclonal | Abcam, UK | 1:1000 |
| EpCAM | VU-1D9 | Mouse, monoclonal | Calbiochem, Germany | 1:1000 |
Table 1: The properties of the antibodies used in this study.
Evaluation of immunostaining
The entire sections were evaluated via immunohistochemistry. MCM2 staining was judged as positive when an immunoreaction was observed in the nucleus. In contrast, positive CD133, CD44, ALDH1, and EpCAM expression was confirmed when a definite membrane/ cytoplasmic immunoreaction were observed. The expression extent of MCM2 was evaluated as follows: low when <30% of positive tumor cells were detected and high when >30% of positive tumor cells were detected. The MCM2 labelling index was calculated as the percentage of positive nuclear cells in at least 1000 tumor cells counted. All immunohistochemical slides were evaluated three times by XJ (pathologist), who was blinded to the clinical data. If the results of the three evaluations differed, a final evaluation was made by consensus with another pathologist (KY and MK). Most of the stained sections showed nearly obvious differences between the high and low expression groups.
Statistical analyses
All statistical analyses were conducted with the EZR software (Saitama Medical Centre, Jichi University, Japan). For the analysis of OS and RFS, survival curves were generated by the Kaplan-Meier method and were compared by the log-rank test. A Cox proportional hazards model was used for the univariate and multivariate analyses of OS and RFS. For all statistical analyses, a P-value <0.05 was considered significant.
Results
Expression level of stemness markers and MCM2
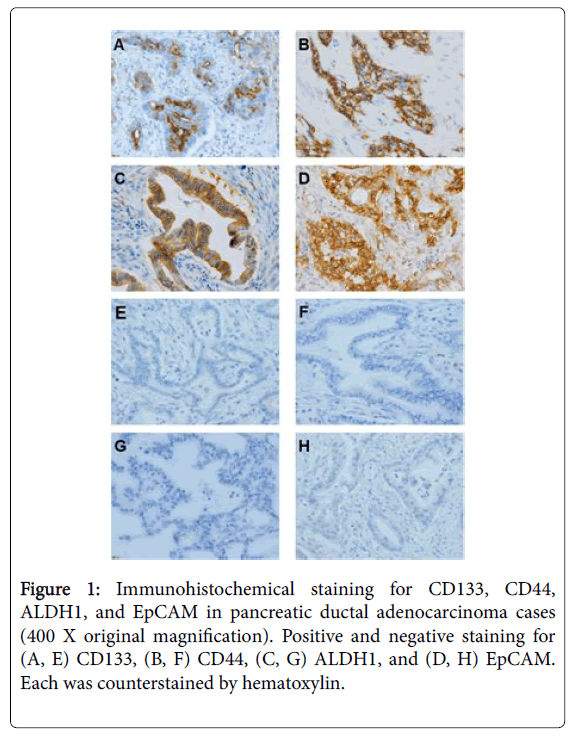
To check the expression level of each stemness marker and MCM2, we performed immunohistochemical staining (Figure 1).
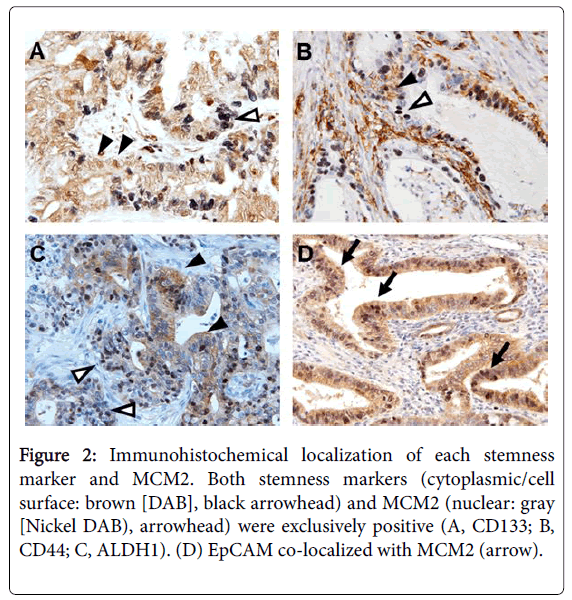
For CD133, a positive signal was detected in the cytoplasm, and the positivity ranged 0%-60% (median, 20%) (Figure 2).
Figure 2: Immunohistochemical localization of each stemness marker and MCM2. Both stemness markers (cytoplasmic/cell surface: brown [DAB], black arrowhead) and MCM2 (nuclear: gray [Nickel DAB), arrowhead) were exclusively positive (A, CD133; B, CD44; C, ALDH1). (D) EpCAM co-localized with MCM2 (arrow).
Using the condition of a 5% threshold, 17 of 44 cases (39%) were positive for CD133. For CD44, a positive signal was detected in the cell membrane, and the positivity ranged 0%–30% (median, 10%). Using the condition of a 5% threshold, 12 of 44 cases (27%) were positive for CD44. For ALDH1, a positive signal was detected in the cytoplasm, and the positivity ranged 0%-90% (median, 60%). Using the condition of a 20% threshold, 36 of 44 cases (81%) were positive for ALDH1. For EpCAM, a positive signal was detected in both the cytoplasm and cell membrane, and the positivity ranged 0%-40% (median 20%). Using the condition of a 10% threshold, 21 of 44 cases (47%) were positive for EpCAM. MCM2 was localized to the nucleus, and the positivity ranged 10%-70% (median, 30%). To determine whether each stemness marker and MCM2 co-localize, we performed double immunostaining (Figure 2). Among the positive cases of stemness markers, EpCAM tended to co-localize with MCM2. In contrast, CD133, ALDH1, and CD44 tended to be exclusively positive with MCM2 (Figure 3).
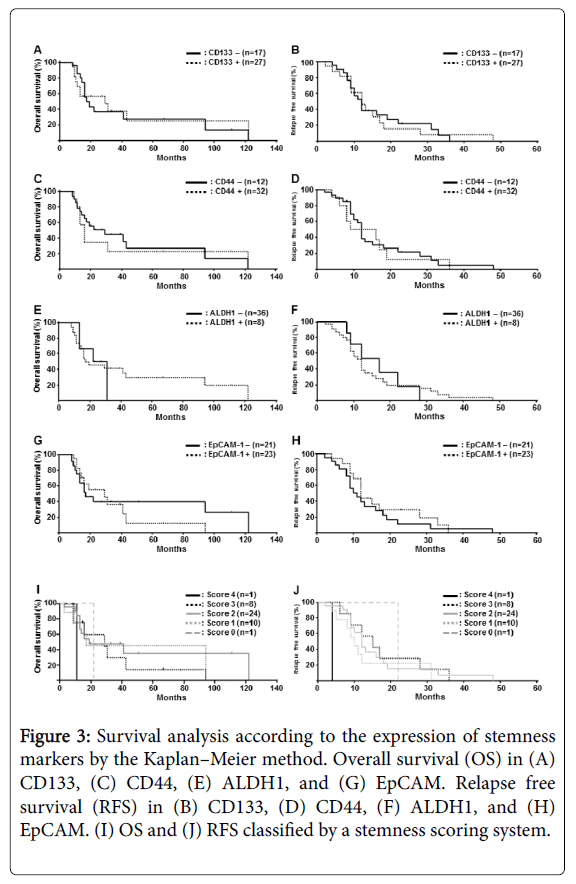
Figure 3: Survival analysis according to the expression of stemness markers by the Kaplan–Meier method. Overall survival (OS) in (A) CD133, (C) CD44, (E) ALDH1, and (G) EpCAM. Relapse free survival (RFS) in (B) CD133, (D) CD44, (F) ALDH1, and (H) EpCAM. (I) OS and (J) RFS classified by a stemness scoring system.
Correlation between the expression of stemness markers and clinicopathological findings
Next, we analysed the correlation between the expression of each stemness marker and clinicopathological findings. There were no significant differences in either OS or relapse-free survival (RFS) among the four stemness markers (Figure 3). To evaluate the frequency of stemness positivity in each case and clinicopathological findings, a stemness scoring system was established: score 0, negative for all the four stemness markers; score 1, positive for only one stemness marker; score 2, positive for two stemness markers; score 3, positive for three stemness markers; score 4, positive for all the stemness markers. As shown in Figure 3, although there were no significant differences, patients with a high stemness score tended to have a worse clinical course with respect to OS and RFS.
Correlation between the expression of stemness markers and MCM2 and clinicopathological findings
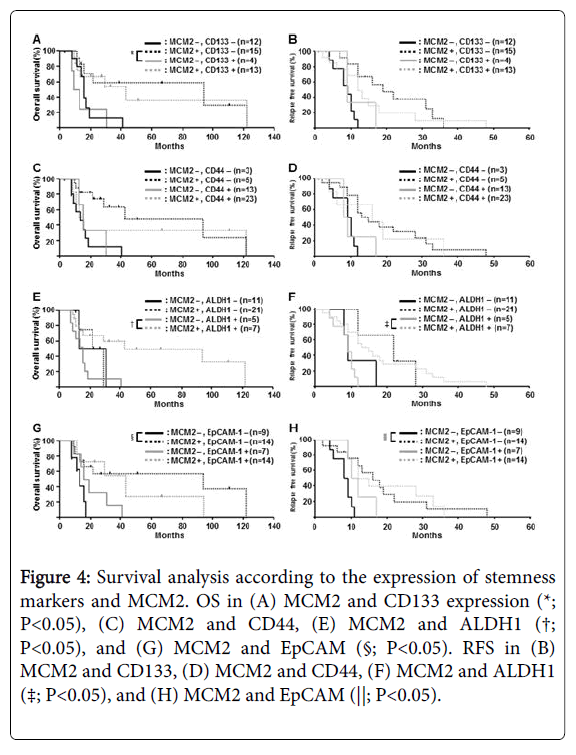
We then investigated the correlation between the expression of stemness markers and MCM2 and clinicopathological findings (Figure 4). For CD133 and MCM2, MCM2-low and CD133-positive patients had a significantly worse OS than MCM2-high and CD133-negative patients (P=0.014) (Figure 4). For ALDH1 and MCM2, MCM2-low and CD133-positive patients had a significantly worse OS than MCM2-high and ALDH1-positive patients (P=0.019) (Figure 4). For EpCAM and MCM2, MCM2-low and EpCAM-negative patients had a significantly worse OS than MCM2-high and EpCAM-negative patients (P=0.041) (Figure 4). Interestingly, there was a tendency for patients determined as stemness marker positive with low expression of MCM2 to have a worse prognosis than those with a high expression of MCM2 (Figure 4).
Figure 4: Survival analysis according to the expression of stemness markers and MCM2. OS in (A) MCM2 and CD133 expression (*; P<0.05), (C) MCM2 and CD44, (E) MCM2 and ALDH1 (†; P<0.05), and (G) MCM2 and EpCAM (§; P<0.05). RFS in (B) MCM2 and CD133, (D) MCM2 and CD44, (F) MCM2 and ALDH1 (‡; P<0.05), and (H) MCM2 and EpCAM (||; P<0.05).
Prognostic significance of the cancer stem cell-like phenotype on overall survival
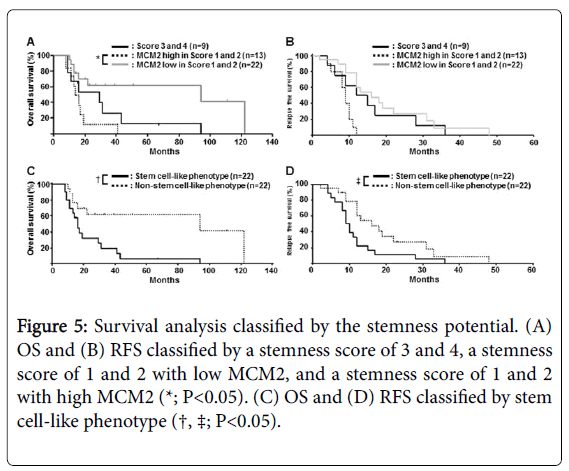
Considering the fact that patients with a high frequency of stemness marker expression tended to have a worse clinical outcome (Figure 3), we hypothesized that both, a high expression of stemness markers (scores 3 and 4) and a low expression of MCM2 (scores 1 and 2), had a common cancer stem cell-like potential. To verify this hypothesis, we compared cases with a high MCM2 plus a low stemness score (scores 1 and 2) and cases of low MCM2 plus a low stemness score (score 1 and 2). As shown in Figure 5, patients with a high MCM2 plus a low stemness score (scores 1 and 2) had a significantly worse clinical outcome in terms of OS (P=0.024). Because there was no significant prognostic difference between those with a high stemness score (scores 3 and 4) alone and those with low MCM2 plus a low stemness score (scores 1 and 2), we defined a high stemness score and a low MCM2 expression with stemness score (scores 1 and 2) as a stem cell-like phenotype. The group with stem cell-like phenotype, with high MCM2 and a stemness score of 1 or 2, had a significantly worse OS (P=0.030) and RFS (P=0.019) (Figure 5).
Figure 5: Survival analysis classified by the stemness potential. (A) OS and (B) RFS classified by a stemness score of 3 and 4, a stemness score of 1 and 2 with low MCM2, and a stemness score of 1 and 2 with high MCM2 (*; P<0.05). (C) OS and (D) RFS classified by stem cell-like phenotype (†, ‡; P<0.05).
To evaluate the relationship between clinical outcome and stem celllike phenotypes in PDAC, various clinicopathological factors were investigated. There was no correlation between the stem cell-like phenotype and any clinicopathological factor including age, sex, smoking, diabetes, venous permeabilization, lymphatic permeabilization, neural invasion, jaundice, lymph node metastasis, tumor site, tumor size, tumor differentiation, and tumor stage (Table 2).
| Stem cell marker | P-values | ||
|---|---|---|---|
| Stem cell-like phenotype | Non-stem cell-like phenotype | ||
| Age | |||
| ≥60y | 19 | 16 | 0.262 |
| <60y | 3 | 6 | |
| Gender | |||
| Male | 8 | 14 | 0.070 |
| Female | 14 | 8 | |
| Smoking | |||
| Yes | 2 | 4 | 0.380 |
| No | 20 | 18 | |
| Diebetes | |||
| Yes | 9 | 7 | 0.531 |
| No | 13 | 15 | |
| Venous permeabilization | |||
| Yes | 21 | 22 | 0.312 |
| No | 1 | 0 | |
| Lymphatic permeabilization | |||
| Yes | 20 | 18 | 0.380 |
| No | 2 | 4 | |
| Neural invasion | |||
| Yes | 20 | 20 | 0.600 |
| No | 2 | 2 | |
| Jaundice | |||
| Yes | 6 | 7 | 0.741 |
| No | 16 | 15 | |
| Lymp node metastasis | |||
| Yes | 7 | 9 | 0.531 |
| No | 15 | 13 | |
| Tumor site | |||
| Head | 10 | 8 | 0.540 |
| Body | 12 | 14 | |
| Tumor size | |||
| ≤4 | 16 | 17 | 0.728 |
| >4 | 6 | 5 | |
| Tumor differentiation | |||
| Well | 5 | 7 | 0.499 |
| Med, por | 17 | 15 | |
| Tumor stage | |||
| I, II | 3 | 4 | 0.680 |
| III, IV | 19 | 18 | |
Table 2: Patient characteristics as stratified by stem cell-like phenotype status.
These results suggested that the stem cell-like phenotype is a potential independent prognostic factor for PDAC. In the uni-variate analysis, tumor size (P=0.027), tumor stage (P=0.0083), and stem celllike phenotype (P=0.030) were significantly associated with worse overall survival (Table 3). In the multivariate Cox regression model, tumor stage (P=0.0144) and stem cell-like phenotype (P=0.0273) remained independent factors of poor prognosis (Table 3).
| Variable | Category | No. of patients | P value by Wilcoxon test | HR* | 95% Cl | P value by Cox proportional hazards |
|---|---|---|---|---|---|---|
| Age | ≥60y | 35 | 0.458 | |||
| <60y | 9 | |||||
| Gender | Male | 22 | 0.798 | |||
| Female | 22 | |||||
| Smoking | Yes | 6 | 0.100 | |||
| No | 38 | |||||
| Diabetes | Yes | 16 | 0.607 | |||
| No | 28 | |||||
| Venous permeabilization | Yes | 43 | 0.187 | |||
| No | 1 | |||||
| Lymphatic permeabilization | Yes | 38 | 0.273 | |||
| No | 6 | |||||
| Neural invasion | Yes | 40 | 0.090 | |||
| No | 4 | |||||
| Jaundice | Yes | 13 | 0.764 | |||
| No | 31 | |||||
| Lymph node metastasis | 0 | 16 | 0.500 | |||
| ≥1 | 28 | |||||
| Tumor site | Head | 26 | 0.889 | |||
| Body, Tail | 18 | |||||
| Tumor size | ≤4cm | 33 | 0.027 | |||
| >4cm | 11 | |||||
| Differentiation | Mod, por | 32 | 0.730 | |||
| Well | 12 | |||||
| Tumor stage | I, II | 7 | 0.008 | 0.0144 | ||
| III, IV | 37 | |||||
| Stem cell-like phenotypes | Stem cell like | 22 | 0.030 | 2.763 | 1.121-6.813 | 0.0273 |
| Non-stem cell like | 22 |
Table 3: Univariate and multivariate analyses of stem cell-like phenotype influencing overall survival.
Discussion
Regarding the stemness markers of pancreatic cancer, the strong expression of CD133, CD44, ALDH1, and EpCAM in cancer cells did not correlate with patient prognosis (RFS and OS). These results were not necessarily consistent with those of previous studies [15,21-23], probably due to the differences in numbers and characteristics of patients with PDAC in the present study.
Having cancer cells with a higher expression of MCM2 was associated with a better prognosis in the present study. In other cancers, MCM2 expression correlates with increased cancer proliferation as well as poor prognosis [27-29]. Usually, cancer stem cells are expected to have low proliferative activity and pluripotent activity of cell differentiation. Thus, in pancreatic cancers, the characteristic of stemness in cancer cells with high MCM2 expression might be associated with a worse prognosis. This would be consistent with the chemo- and/or radio-therapy-resistant nature of cancer stem cells. Furthermore, we showed that stemness phenotype, defined as a stemness score of 3 and 4 or a score of 1 and 2 with low expression of MCM2, represented a poor prognosis for pancreatic cancer patients. This combination of phenotypes might more precisely evaluate the cancer stem-like feature of cancer cells in the pathological samples of pancreatic cancers.
In addition to the stemness marker phenotype, several phenotypes of pancreatic cancers have been shown to be associated with patient survival. They include epithelial mesenchymal transition (EMT)- associated markers [30], WNT signal-associated markers [31], microRNAs [32], mucin markers [33], p53, and Ki-67 [33,34]. The interaction between stemness markers and previously defined prognostic factors should be clarified to further analyze the phenotypespecific character of cancer cells in relation to the biological behavior of pancreatic cancer.
A limitation of this study was the small number of pancreatic cancer cases. Further studies using a larger cohort are necessary for the precise estimation of the effect of cancer stemness markers/MCM2 expression on the prognosis of patients with pancreatic cancer.
Acknowledgement
This work was supported in part by a Grant-in-Aid from the Ministry of Education, Culture, Sports, Science, and Technology of Japan (No. 15K08394).
References
- Bosman FT, Carneiro F, Hruban RH, Theise ND (2010) WHO classification of tumours of the digestive system. (fourth edition), WHO Press, Geneva.
Citation: Jin XH, Yamamoto K, Abe S, Onishi I, Kirimura S, et al. (2016) Prognostic Impact of Cancer Stem Cell-Like Phenotypes in Pancreatic Ductal Adenocarcinoma. J Clin Exp Pathol 6:295. DOI: 10.4172/2161-0681.1000295
Copyright: © 2016 Jin XH, et al. This is an open-access article distributed under the terms of the Creative Commons Attribution License, which permits unrestricted use, distribution, and reproduction in any medium, provided the original author and source are credited.
Share This Article
Recommended Journals
ĚěĂŔ´«Ă˝ Access Journals
Article Tools
Article Usage
- Total views: 11381
- [From(publication date): 10-2016 - Jan 25, 2025]
- Breakdown by view type
- HTML page views: 10635
- PDF downloads: 746
